Sunday, January 20, 2013

Last week's Gates Report

So the Gates Foundation released a report last week about measuring teacher quality.  Their analysis took several unusual steps:

  1. First, they took three sources of data--observational evaluations, value-added metrics applied to prior years, and student evaluations of teachers--and considered which combination of them was more predictive of teacher success.
  2. Second, they measured teacher success using a value-added metric applied to randomized classes.  That is, teachers were compared based on their success (or failure) with students who had been randomly assigned to their classes;  by contrast, many elementary schools exert some effort in putting kids with the "right" teachers.  The Gates study attempted to minimize selection bias in this way.
  3. Third, they considered other criteria for an evaluation systems's success besides its predictive power on state tests:  year-to-year stability and student performance on tasks that they euphamistically described as "higher-order" (i.e. involved actual thought, not just rote facts and skill application).
The findings were pretty striking:
  • The VAM was predictive of student's future success in testing; in fact, of the four weighting systems they studied, the one that was most predictive of student's test scores was the one that weighted VAM most highly:


  • The equal weights scheme produced a reasonably high correlation with state tests gains without sacrificing as much on the higher order tests or on reliability.
So what should we make of this?  Is this a vindication of VAM?  I'm not so sure, for a couple of reasons:

  1. Whether a test is designed to measure growth or not is an important issue that isn't addressed by simplistic "Look at whether test scores increase or not."  Increasing from a 400 SAT to a 500 SAT is different from increasing from a 500 to a 600, a 600 to a 700, or a 700 to an 800.  So simply pointing to these data and saying "Look, VAMs work!" doesn't address the underlying issue of the test itself:  the reason these VAMs might work is that the underlying tests are better.
  2. There's an odd kind of solipsism to this report, as my friend Sendhil pointed out.  I mean, we're talking about predicting students' gains on tests by using prior students' gains on the same tests. So it shouldn't surprise us that the predictions went pretty well. (Although a graph like this one -- showing VAM scores for the same teachers, same classes -- shows that it's not exactly a slam dunk:

    ).
  3. As a classroom teacher, I can attest that there's no such thing as a double-blind study:  the students know whom they're getting, even if they're randomly assigned.  As a longtime teacher in my school with a good reputation, I can ask things of my students that other teachers simply can't ask:  harder projects, more retakes, etc., because students trust me in a way that they might not trust another teacher.  So it's still possible that students who know--as the VAM people keep telling us, "everyone knows" who the good teachers are--that their teachers are among the good ones therefore do harder work, challenge themselves more, and make more gains, not because of better teaching technique, but because of what they themselves are doing.
  4. Look at those terrible correlations with HOTS (higher-order thinking skills)!  Shouldn't we be trying to figure out what will make students do better on those?

Sunday, January 13, 2013

Psychiatrists:Lighbulbs :: PD-givers:???

One of my favorite jokes goes like this:
Q: How many psychiatrists does it take to change a lightbulb?
A:  Only one, but it has to really want to be changed.
I think about this joke a lot in my current role as curriculum coordinator, and also as a parent of three school-going children.  I think about when I observe a teacher at my school doing something that's -- well, let's say commonly-accepted but low-impact.  And when my kids come home from school with some story about pedagogy that just makes me wince--for example, starting class by going over homework answers, which (for those of you who don't know) pretty much stops any job interview with me in its tracks.  I think to myself: I could tell this teacher what s/he's doing is bad and why it's bad.  And yet, I don't think that initiating that conversation would change anything.  The teacher has to really want to change.

So what gets a teacher to want to change?  Because I'm in pessimistic mode, this is a shortlist of things I've found that don't work as well as they should.

  1. Unsuccessful students.  We have an amazing capacity to rationalize failure of individuals or groups.  How often have I said "----'s a weak student" rather than asking "How can I address ---'s weaknesses?  More often than I'd care to admit.
  2. Successful students.  When we look at a school (class, teacher) who is producing consistently excellent results, do we ask "what is their practice?"  Or do we say "their kids/budget/materials/prep time/----" is different?
  3. Data from actual lessons.  "Did you realize you spent 20 minutes going over homework problems?" "Yeah, it's a pain, but they really need to go over the answers they don't know."
  4. Professional development.  PD is the least effective instigator of change: it supports change initiatives that teachers already buy into.
Having said that, I think that 1, 2, and 3 can actually work -- with repetition, reflection, and most of all, a climate in which it's okay to admit failure.  The best part of the math office at Payton--when I was a regular teacher, and I think still today--was that you could walk in and say, to your colleagues, about your own class "Wow, that lesson just stank!"  More good conversations started that way than in official meetings; that moment--the moment you realize you need to do something different, or differently--is so valuable and fleeting, it needs to be honored.  In hospitals, they have regular, formal meetings for doctors to share their failures:  morbidity and mortality meetings, where doctors discuss how patients died, and think together about how to avoid those failures in the future.  Why not in schools?

In my current job, I try to emphasize that I'm here to help; some teachers are open about those conversations, but of course not all.  But I wonder: as we increase the stakes and the pressure, do we enable those all-important conversations--or shut them down?

Sunday, January 6, 2013

Jiro Dreams of Sushi

I just saw Jiro Dreams of Sushian award-winning documentary about Jiro Ono, an 85-year-old sushi chef in Japan and proprietor of the first sushi restaurant (a ten-seat establishment inside a subway station) to be awarded a Michelin 3 Star rating.  It's also a film-length meditation on teaching, learning, and excellence, which is why I'm blogging about it.  It has many messages and discussions about art, craft, and teaching, but I'm going to pull out three.

  1. The essence of excellence is doing simple things consistently well.  At the start of the movie, you might think: sushi?  How complicated can raw fish on rice be?  What we learn is that it's not complicated, it's just hard to get exactly right every single time.  One critic mentions that, in all his years of attending Jiro's restaurant, he has never had a meal that wasn't fantastic.  Jiro himself has been fanatical in stripping down his work to the essentials:  he stopped serving appetizers, and now only serves sushi.  And what makes his sushi so good?  He gets the very best fish, and doesn't settle for less than the best preparation.  At one point, we meet Jiro's rice supplier, and hear the following (paraphrased) exchange:

    Supplier:  Hyatt hotel wanted me to sell them the same rice I sell you, but I said no--because I didn't want to betray our relationship, but also because they don't know how to cook it.

    Jiro:  Go ahead and sell it to them.  They don't know how to cook it, so it won't be any good.

    Supplier:  That's right.  It won't be any good unless they know how to cook it.  You're the only one who knows how to cook it.

    At this point, you're probably wondering--I was--how complicated can cooking rice be?  But Jiro has developed a special method for cooking this rice--they show it to us--that brings out its special qualities.  By the end of the segment, you're convinced:  how you cook this rice is really important.

    How does this relate to teaching?  As with any other "simple" art, there's no way to hide imperfection. With sushi, it's just fish and rice, so if the rice isn't good, the sushi isn't good.  When you watch a great teacher, what's great isn't just the overall lesson design or the major tasks--it's the details of how he or she handles the lesson's flow, how papers get returned (hint: not during the lesson itself!), what happens when students make errors or ask unexpected questions...the myriad tiny details that actually shape the experience of being in the classroom for the lesson.  And so great teachers think about these things:  a book like Every Minute Counts or Teach Like a Champion is really a compendium of dozens or hundreds of techniques to make those details perfect.
  2. Mastery is a process, not a destination.  Jiro is described several times as a shokunin, a Japanese term for "master craftsman."  But he doesn't see his own status as "the master," even though everyone -- the people who supply his fish, his apprentices, restaurateurs -- treats him with reverence.  Jiro himself is constantly innovating, asking himself how to do things better.  One example is his decision, in his mid-70's, to stop serving appetizers--to really focus his (and his customers') attention on the sushi. Another his adjustments to his processes for preparing octopus (he increased the massaging and marinating time).  At one point, Jiro compares his own palate to legendary French chef Daniel Boulud's, saying that if he (Jiro) had a more discriminating palate, he would be able to make sushi even better.  This attitude runs deep in Japanese culture: the shokunin never regards his own status as "mastery" but rather as "continuing to grow."

    There are many ways to relate this to teaching, but the most important is maybe the least obvious:  the really great teachers I've known are also the most self-critical of their own lessons.  These teachers leave the room, most days, feeling not like they just made a slam dunk, but wondering about different things that happened, could have happened, or didn't happen.  When a teacher tells me that he felt the lesson went "really well," that tells me that--usually--the teacher is still a long way from mastery.

    There are two reasons for this self-criticism.  First, the way you become a master at anything is by being very self-reflective and critical of your own work.  But there's more:  as you get better at teaching, you get better at noticing the tiny details (see #1) that make a lesson work or not work.  It's impossible to get all those details perfect every single time; the master teacher is always dissatisfied because he or she sees so much that could have gone better.  (This phenomenon is similar to the experience of doing well on a law school examination, where the key is to identify the legal issues presented in a situation:  the best students get only about 70-80% of the issues, but are also the most aware of the 20-30% they missed, while students who understand the material less well think that the 50-60% they spotted are all the issues there are.)
  3. Teaching people to be masters requires holding them to high standards, every time.  At Jiro's restaurant, the apprenticeship is ten years.  Only in the last year do students get to make the tamagoyaki, a kind of sweet egg omelet eaten at the end of the meal.  One apprentice describes making the omelet two hundred times before Jiro pronounced it acceptable.  But he's not fired, reprimanded--that we can tell-or punished in any way:  he's simply told, each time, that it's not right yet (and, presumably, how it's wrong or how to fix it).

    In our education system, we claim to hold students to high standards, but we often make it impossible to really do that.  Think of the traditional unit structure:  homework (often ungraded), a couple of quizzes, and then a unit test a day or two after the conclusion of new material.  A kid only has two or three opportunities to figure out how to do the tasks before he's held to account for them.  As a result, we make the tasks easier, or give partial credit--because doing something challenging exactly right requires way, way, way more attempts and feedback than this structure provides.

    Standards-based grading provides an opportunity to change that structure, but as teachers at Payton are figuring out, it can mean a lot more work:  students try again and again to meet those high standards, and as a teacher you have to create sample tasks, and give feedback, for each of those attempts.  But we've found that standards-based grading allows us to hold students to very high standards, to be very clear about what we expect students to know and be able to do--and to be really sure that they can do the things we want.  In short, standards-based grading helps us ensure that students are really learning to do tasks consistently well.

    Does this system work?  Return to Jiro's restaurant.  At the end of the movie, we find out an important fact:  over all of the Michelin reviewers' visits to Jiro, he was never actually the sushi chef on duty.  His (middle-aged) son and his apprentices, not Jiro himself, were the ones who prepared the sushi that, Michelin said, deserved no less than a three-star rating.  
Jiro Dreams of Sushi is a great movie.  I saw it on Amazon streaming (free to Prime members), but you can also get it on Netflix, etc.  What I've put in here is just a small taste of what I got from the movie; I hope that you, like me, leave wanting more.

Tuesday, October 30, 2012

Why Zeros for Late Homework are Stupid -- a general theory

In a presentation today, the really-awesome Sean Stalling mentioned offhandedly that the common policy of automatic zeros for late homework assignments is devastating to kids grades, discouraging, and just dumb.  (My words, his sentiments, I think.)  But not everyone already believes this now-obvious-to-me idea--I didn't always believe it either--so here's why it should be obvious.

1.  Even one or two zeros has a really devastating effect on a student's grade, especially in a traditional 90-80-70-60 scale, even worse if the people are using one of those idiotic "honors" 94-88-80-75-65 scales.  (These scales are idiotic, because performance on more complex tasks--the kinds you'd want students to be doing in honors courses--is harder to replicate, so you should if anything have a looser grading scale that allows kids to show excellence sporadically and still get good grades.  For example, classes for math majors at the college level not-infrequently use the "sup norm": your grade is primarily based on the highest score you get on a test, rather than the average; lower scores are basically ignored.  But I digress.)  For example, a student with a consistent 90% average on 9 assignments (low A) drops to a low B with a single zero, and even if the student gets 100's on every assignment thereafter, it will take that student 9 consecutive 100's to bring that grade back up to an A.  Put differently, on the 90-80-70-60 scale, a kid needs to have 95's on EIGHTEEN assignments to get an A if he or she gets a single zero.

It's depressing that so few teachers using this system understand this.  I mean, are they blind?

2.  Students DO understand this, and so after a couple of zeros, they correctly conclude that there's really no point in trying anymore.  This outcome is bad for everyone, because it means that the students stop making any attempt to learn any of the material, and just sit around disrupting your class.  You as a teacher lose both your carrot and your stick.

3.  This system, when applied to homework, is even stupider, because the only point of homework is to (a) develop the ability to work independently and (b) develop knowledge of the material.  If the student is not doing homework, a system that very quickly tells him or her not to bother to do any more homework is obviously not going to develop his or her ability to work independently, and is obviously not developing his or her knowledge of the material.  

4.  In fact, if you think about why students might skip doing homework, I consistently hear three reasons.  (i) I can't do it or don't see the point; (ii) I can do it easily and so I don't see the point; (iii) I have too much other homework to do.  In case (i) , the student is telling us that he/she can't actually work independently on the assignment, or that there's no obvious reason to do so.  So a zero penalizes the child for not doing something he or she perceives as either undoable or pointless.  In case (ii), the child is saying that while he or she could work independently, the assignment is not actually going to develop his or her knowledge of the material.  So giving a zero feels to me like you're mad at the child for uncovering the secret that your assignments are actually irrelevant to their learning process, whereas instead you should be saying something like "good metacognition; what was something interesting you were thinking about?"  In case (iii), the issue is not that the kid doesn't recognize the importance of the assignment, but that he or she has too much other stuff to do to actually get done this thing that he/she agrees is important.  So giving a zero penalizes the child for a problem not of his or her own creation, and frankly, makes you part of that problem instead of being part of that solution.  (Note that your work has been given a lower priority than other work, usually--in my experience--other work that the student felt more relevant to his/her learning, or more within his/her grasp, or with more obvious positive/negative consequences.) 

5.  Therefore, you as a teacher should do everything in your power to avoid students getting zeros:  give them second chances to do assignments, make them up in front of you, show proficiency in alternative ways, etc.  In particular, you should avoid as much as possible policies that give automatic zeros for any but the worst behaviors.

6.  Finally, giving an automatic zero for a late assignment is just stupid, because what you're telling the kid is that doing the work one single day after it was due is totally useless.  But what kind of teacher assigns work that is meaningless past a 24-hour expiration date?  This is supposed to be cognitive development, not milk left out on the counter.  Of course, there are occasionally assignments that really need to get done by a specific time in order to set something up for class.  But then that can be communicated directly, outside of the code of grades.  "I really need you to do those coin flips tonight, because tomorrow we're going to aggregate our data."  "I really need you to practice these derivatives tonight, because tomorrow we're going to work on applications."  "It's really important that you do the assigned reading every night, because otherwise you'll have nothing much to say in our discussion of the texts the next day, and you won't even really understand what the rest of us are arguing about."  And then you make the assignments short and meaningful; in the last case, for example, you can assign a short response paper rather than an outline or ... 

If the homework is essentially skills practice, and the skills are important, then the kid will still be well-served by doing the practice a day or two later.  In fact, if you ask more questions instead of giving the kid the zero, you might find out that the kid didn't feel intellectually able to tackle the material when he/she got home: you're penalizing the kid for being a slow learner.  

7.  Finally finally, it's important to remember how much relying on work done at home for learning privileges kids who are already privileged:  kids who don't have to work to help their families pay rent, kids who don't have to watch small children (brothers/sisters/cousins) so that other family members can work to pay rent, kids who have a quiet and reasonably conflict-free space in which to work, kids who have parents or other family members whom they can ask for help, kids who have consistent access to the internet or other non-parental sources of instructional support.  Yes, it's important that kids do learn to do work outside a supervised environment, and yes, it's often difficult if not impossible to get everything covered and practiced in the time allotted.  But remember that every time you rely on homework as a part of the learning process, you're giving more advantages to the kids who already have the most, and throwing up another barrier to the success of disadvantaged kids, which is really the opposite of what public school is supposed to be about.

OK.  That's off my chest.  But I'll sign off with one last h/t to Sean, who is really awesome.  When asked by an audience member why we should assign grades in a way that allows kids multiple opportunities when "in real life, you have to get it right the first time," Sean gave the courageous--and totally true answer--that in real life, you almost never have to get it right the first time.  Most of us have made LOTS AND LOTS of mistakes in our jobs without getting fired--often,without being yelled at.  And even the "exceptions" Sean cited--surgeons and airplane pilots--are not really exceptions:  they just practiced, under supervision, in training, getting it wrong lots and lots of times in simulations (sewing cadavers, practicing takeoffs in a flight simulator or with someone else sharing controls) until their accuracy rate improved to an acceptable value for "real life."  This is learning, peoples, not the Spanish Inquisition.

Monday, October 1, 2012

What Could Go Wrong with Value-Added Metrics?

In my last post, I explained what a value-added metric is.  Simply put, a value-added metric combines three things:
  1. Data taken before and after some intervention, and
  2. A model that uses pre-intervention data, possibly along with other factors, to predict the post-intervention data.
  3. An interpretation of any differences between the post-intervention data and the model.
In the last post, the data were heights of trees; the intervention was a fertilizer treatment, and the model was the linear model based on the data from the unfertilized trees.  In the case where the treated trees grew more than the model predicted, the interpretation is that the fertilizer was effective.  In a value-added metric for teaching, the data are test scores, at the beginning and end of year.  The model predicts end-of-year gains for "typical" students.  The interpretation is typically that the differences between actual and predicted results are a measure of teacher quality.

There's been lots of misinformation about value-added metrics; before we deal with what's wrong with this scheme, we need to make sure that we're not spouting half-baked criticisms that make us all sound ignorant.

Half-Baked Objection 1:  It's not fair to penalize teachers whose students don't end the year at grade level when those kids start the year behind grade level.
The VAM doesn't simply score students based on their end-of-year scores, but looks for growth from the beginning of the year to the end of the year.  So if a group of students starts 5th grade reading at the 3rd grade level, and finishes the year reading at the 4th grade level, the teacher is supposed to get credit for a year of growth.
Half-Baked Objection 2: Students aren't plants, and teachers aren't fertilizer.
Of course they aren't.  But by itself, this objection says "You can't measure anything." And while measuring teachers badly hurts the profession, claiming that what we do can't be measured doesn't help either.
*     *     *     *     *
What is it reasonable to expect of a measure of teacher quality?  Let's establish a few criteria:

  1. Longitudinal Consistency Teachers change over time, but not necessarily that much in any given year.  So unless we have evidence that a teacher is taking substantial steps to improve his or her practice, or strong evidence that something has come unhinged, we would expect teacher scores to stay roughly the same from one year to the next. If teacher scores fluctuate wildly, that casts doubt on whether the score is really measuring something that the teacher is doing.
  2. External Validity There are research-based strategies for exemplary teaching; that is, people have actually compiled lists that describe what teachers need to do to be effective.  One such model is Charlotte Danielson's Framework for Teaching, but it's not the only one.  Because these strategies are themselves validated by research demonstrating their impact on student learning, we would expect that, in general, teachers who are doing the things on these lists would score highly on the value-added metric, and that teachers who are not doing these things would score poorly.  Of course, there's no canonical list that we need treat as gospel: it's possible that, over time, our views of what constitutes good teaching will evolve, and that this evolution will be informed by results of a metric system.
  3. Fairness We don't want our measurement system to treat one group of teachers differently from another, and it should be mostly immune to sabotage or "gaming" by malevolent or savvy administrators and teachers.
  4. Appropriate Incentives Peter Drucker's maxim "What is measured, improves," has a corollary:  make sure you measure the things that you want to improve.  In an era when almost any fact can be Googled, when the phrase "21st Century Skills" has gone from a war cry to a banality, we need to be careful that our metric creates incentives for teachers to teach the skills, concepts, and habits that we want kids to learn.  We also want to ensure that the metric doesn't create perverse incentives for teachers to skip over crucial content, revert to large-scale rote memorization, or avoid teaching certain students.  For example, the current NCLB regime has the well-documented "Bubble Effect":  it's to a teacher's advantage to concentrate on those students who are near the proficiency borderline, to the exclusion of students who are so far from proficiency that a single year's work is unlikely to make the difference.  
There are probably lots of other criteria we could use, but this list makes a fair start.  The next question is: how well do current systems measure up?

Thursday, September 20, 2012

What the heck is a Value-Added Metric?

In conversations in and around Chicago these last two strike-filled weeks, one item has captured center stage:  the use of value-added metrics in teacher evaluations.  As I've been part of these discussions, I've noticed that both opponents and proponents have something in common:  they really don't know what a value-added metric is.

You can tell these people by how they argue about the metric.  For example,  "If the kids start out the year behind, how is it fair to penalize the teacher for the fact that they end the year behind?"  (It wouldn't be, but the "added" part of the value-added metric means that the metric is trying to describe change, not just absolute performance at the end of the year.)  Or "If the class starts out at  80% and then ends at 85%, the teacher's responsible for the other 5%." (The value-added model doesn't compare average scores directly, which is good, because we would hope that students grow over the year anyway.)

I'm no fan of value-added metrics in teacher evaluations, but we won't get anywhere arguing about them if we don't even know what we're arguing about.  So this blog is a sort of crib sheet for teachers and education people who haven't gotten totally immersed in the statistics and psychometrics stuff.

To make this description go, we'll apply it to a situation where a VAM might actually be useful.  Say you want to determine whether a particular fertilizer treatment makes plants grow faster.  If this were your fourth-grade science fair project, you'd just take two groups of plants, compute the mean height of each group, and then treat one group with fertilizer.  At the end of the experiment, you'd compute the mean heights again.  If the fertilized plants have a higher mean height, then the fertilizer works.  Right?

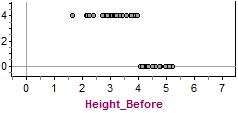
Wrong.  Computing means of groups doesn't tell you much about what happens to the individual plants.  For example, in the (totally cooked-up-to-make-this-point) dataset below, at the end of the experiment, two groups of plants have mean heights of 3.89cm (fertilized) and 4.05cm (unfertilized).  At the end of the experiment, the fertilized plants have mean height 5.97cm, while the unfertilized plants have mean height 6.05cm.  So the fertilized plants have it, by a whisker: unfertilized plants grew an average of 2cm, while fertilized plants grew by 2.08cm.  Problem is, in my model, all I did was assume that the below-average-height fertilized plants grew 4 cm, while the above-average-height fertilized plants didn't grow at all.  All unfertilized plants grew by 2cm.

We can see these differences clearly in the scatterplots below, comparing fertilized (left) with unfertilized (right).  In both graphs, the blue line is y = x, representing no growth at all.  Points above the blue line represent plants that grew; points on the line represent plants that didn't grow, and points below the line (of which there aren't any) would represent plants that actually shrank.


In these graphs, the amount of growth is just the vertical distance from a point to the "no growth" blue line.  Stats types often graph those distances separately, and give them a special name:  "residuals".  In a residual plot, the y-value is the difference (actual value - predicted value):

These residual plots make the situation clear:  the "fertilizer" leaves half the plants worse off than they would have been without fertilizer.  Simple means don't tell this story.

The other problem with comparing means is that data never fall on nice straight lines: as a representation of possible reality, the made-up dataset above is garbage.  A much more realistic set of data for the unfertilized plants (not even worrying about the rest of the experiment) might look like this--but again, I made this one up too:

Heights of Unfertilized Plants

Again, the blue line is y = x:  if a point is on this line, it represents a plant whose final height and initial heights are the same, i..e, it didn't grow at all.  Points above the graph represent plants that grew more; the further the point is from y = x, the more it grew.  Not all plants grew the same amount, but there is a clear upward trend, and it seems like plants that started out taller grew more.  So we can draw a best-fit line:  

Here, the slope of the trendline, 1.27, suggests the average plant grew 27% over the experiment.  But not every plant grew exactly 27%.  If we look at the residuals, we see some "noise":


The fact that these points are not exactly on the 0 line tells us that there are other factors at work, but the fact that they seem randomly distributed about the line suggests that there's no systematic factor (affecting all the plants) that our model is missing.  In fact, if we calculate the mean residual for this dataset, we would get -0.06, suggesting: the average plant is within 0.1 cm of the height predicted by the model. (Whether this difference is significant or not is a whole nother story....)  

Applying that same trendline to the data for the fertilized plants yields an "aha!":
In this case, all the fertilized plants lie above the 27% growth trendline, suggesting that they all grew more than 27%.  Again, we can look at the residuals:


In this case, the average residual is 1.93, confirming what we see on the plot:  the residuals seem clustered about 2cm above the 0 line.  This result suggests that there is another factor at work, possibly the fertilizer.  

If we add a new trendline to quantify the growth of the fertilized plants, we get a model whose mean residual is nearly 0:

The slope of 1.76 suggests that the typical fertilized plant grew by 76%.  So we might say:  fertilized plants grew almost 3 times as much, relative to their original sizes, as unfertilized plants!

The quant way of describing this experiment is in three parts.  In the first part, we acquired some data on how unfertilized plants grow.  In the second part, we used this data to develop a model for plant growth:  a typical plant grows about 27%, and, because r2 =0.83, we conclude that about 83% of the variation in the final plant heights can be attributed to the starting plant height.  The other 17% is the randomness we see in the residual plot.  The model doesn't tell us anything about the other 17% of variation, or even about why the plants grow proportional to their original height--it just describes what seems to happen.  In the third part, we used the model to develop a conclusion about the fertilized plants:  the fertilized plants all grew more than the model predicted, so (we conclude) the fertilizer must be effective.  

Because we have all these numbers about effectiveness, we can even crunch them together to get an effectiveness score.  We can crunch the growth rates:  1.76-1.27, or 1.76/1.27, or 0.76/0.27.  We can use the mean residual of 1.93 for the fertilized plants against the unfertilized model: "The typical fertilized plant grew 1.93 cm more than unfertilized plants."  Notice, though, that the "effectiveness score" quickly stops being meaningful outside of the context of how we computed it: it's just a way of summarizing the relationship between one set of data and another set of data.  Because every plant grew a different amount, we can't point to a single number as being completely representative of the unfertilized plants, or of the fertilized plants, and so we can't just crunch those not-incredibly-meaningful numbers together to get something that's more meaningful.

There's lots of room to argue about why this is a lousy approach to measuring educational performance, but that's not our goal today.  I want to leave with one last set of ideas about modeling.

First, what about the variation in the data--the original dataset, and the 17% "missing" variation we saw in the residuals that we said was due to "other factors"?  If I'm trying to test fertilizers, I do my best to either eliminate other factors or spread them out so much that they cancel each other out.  In the first approach, I might plant all my plants in the same field, or make sure that they are watered completely evenly.  But of course there might be minute but significant variations in soil, sunlight, etc., which I can't physically control to be exactly the same across all plants.  I probably won't level a mountain, or tear down my neighbor's barn, to make sure that all the plants get the same amount of light.  So if I'm being really tricky, I divide up my growing space into a hundred or more small squares, plant one plant per square, and then randomly determine which squares get fertilizer.  While one particular swath of land might get more sunlight, or less standing water, that patch will have both fertilized and unfertilized plants growing on it.  Another advantage of randomizing conditions in this way is that I might be able to get valid results across a wider range of conditions: it doesn't do a farmer in a flat field of acidic soil in North Dakota any good to know that my fertilizer works really well on hilly alkaline fields in Arizona.  

Of course, that kind of experimental control is really hard to obtain in education.  In education, most of the variables are completely outside a researcher's control.  Many are clustered:  the students who are low-income or high-income come with other baggage that affects their education.
So I might use a third approach:  adopt a more complex model that takes more factors into account.  My original meta-model was very simple:  growth is a function of original height.  But if I'm trying to measure the effects of fertilizer on 50-year-old trees, I can't just plant a bunch of trees in small random plots and wait 50 years to start measuring effects.  So what I do is I think of every factor that could affect tree height, measure those factors for each tree, and then come up with a more complex model that predicts height based on all these factors: soil acidity, hours of direct sunlight, proximity to sidewalks, whatever.  But then when I've finished fertilizing and growing, I can do the same basic procedure I did in the simpler case:  apply the model I've developed to the fertilized plants and see whether their growth pattern is substantially different from what the complicated model predicts.  In education research, we might have a model for student performance that takes into account class size, school socioeconomic statistics, etc., and then we'd be trying to see how this model predicts student performance for the students we're trying to study (because they have a particular teacher, or are using a particular curriculum, or ...).

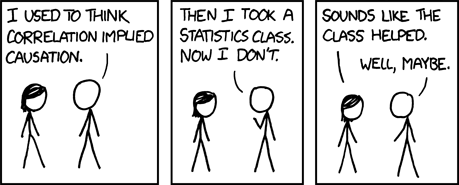
The last caveat is that, of course, the correlation we've observed doesn't tell us much about cause. We don't know why plants that start out taller tend to grow more, or why the fertilizer is effective, or even--unless we've carefully controlled or randomized other variables--whether it's the fertilizer that is making the difference.  There's a great XKCD that makes this point:


I've tried to write this so that it sounds pretty reasonable.  Next time we'll talk about what goes wrong when this approach is applied to measuring teacher quality in education, and the gloves will come off.  I promise.


Monday, July 9, 2012

More Kakaes Followup

In his blog today, Dan Meyers skewers (rightly) Kakaes's basketball metaphor.  Kakaes writes
Math and science can be hard to learn—and that’s OK. The proper job of a teacher is not to make it easy, but to guide students through the difficulty by getting them to practice and persevere. “Some of the best basketball players on Earth will stand at that foul line and shoot foul shots for hours and be bored out of their minds,” says Williams. Math students, too, need to practice foul shots: adding fractions, factoring polynomials.And whether or not the students are bright, “once they buy into the idea that hard work leads to cool results,” Williams says, you can work with them.
and, as Dan points out,
  1. Drills aren't a basketball player's first, only, or most prominent experience with basketball.
  2.  Drills come after a student has been sufficiently enticed by the game of basketball — either by watching it or playing it on the playground — to sign up for a more dedicated commitment. If a player's first, only, or most prominent experience with basketball is hours of free-throw and perimeter drills, she'll quit the first day — even if she's six foot two with a twenty-eight inch vertical and enormous potential to excel at and love the game.
  3. Basketball players aren't bored shooting foul shots.
  4.  Long before "math teacher" was on my resume, I was a lanky high school basketball player trying to get his foul shooting above 50%. I'd shoot for hours but I wouldn't get bored, as Williams suggests I must have been. That's because I knew my practice had a purpose. I knew where that practice would eventually be situated. I knew it would pay off in a game where I'd be called to the line for a shot that had consequences.
Dan's right on target on both points, but I don't think he goes far enough.

  1. Our (national) approach to teaching math is to avoid doing anything requiring actual thought or creativity until we've convinced as many students as possible that there's nothing worth thinking about in math;  eventually, the few "survivors" get to do actual mathematics.  If we taught English that way, it would be all grammar and spelling until senior year, when a lucky few would get to read actual poetry.  Right now, the problem isn't that the U.S. curriculum doesn't have enough skill practice; it's that it doesn't consist of much besides skill practice.
  2. As Dan suggests, what *makes* skills important is their placement within the big picture of doing actual mathematics.  Being able to multiply accurately isn't worth a darn--especially in the age of calculators--if you don't have good ideas about when and what to multiply (and when and what not to).  We can be excited when kids know their times tables, the way we might be excited about a kid being able to spell really well, or lift something really heavy, but by itself, multiplying not a really useful skill except in the context of multiplication tests.

If we taught athletes the way we taught mathematics, there would be no Kobe Bryant, although there would be handful of strikingly eccentric bodybuilders who would get together to run around, lift heavy things, and engage in odd activities that make no sense to the rest of us couch potatoes.